CEEC Energy Curve Program is a program which allows comminution circuit operators to benchmark the energy efficiency of their operations and to contribute anonymously to the database on which the program is based.
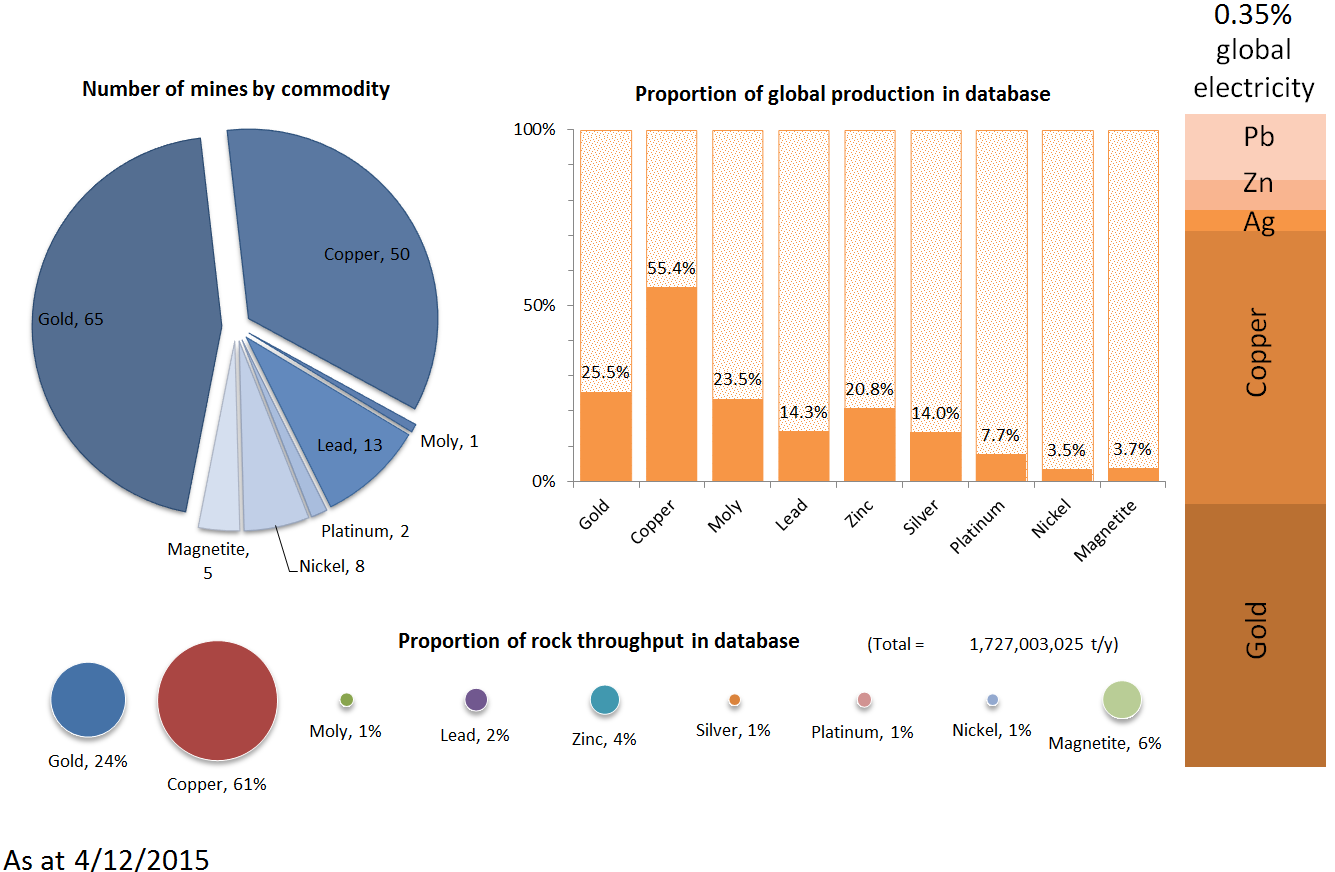
The program uses the benchmarking ideas presented in a survey of the comminution energy requirements of gold and copper producing mines (Ballantyne and Powell, 2014). This work provides reliable benchmarking data which can be used to compare comminution energy consumption across different mine sites.
More details may be accessed here.
Current results
These results are updated weekly. Your individual results are emailed to you.
Diagnostic Interpretation
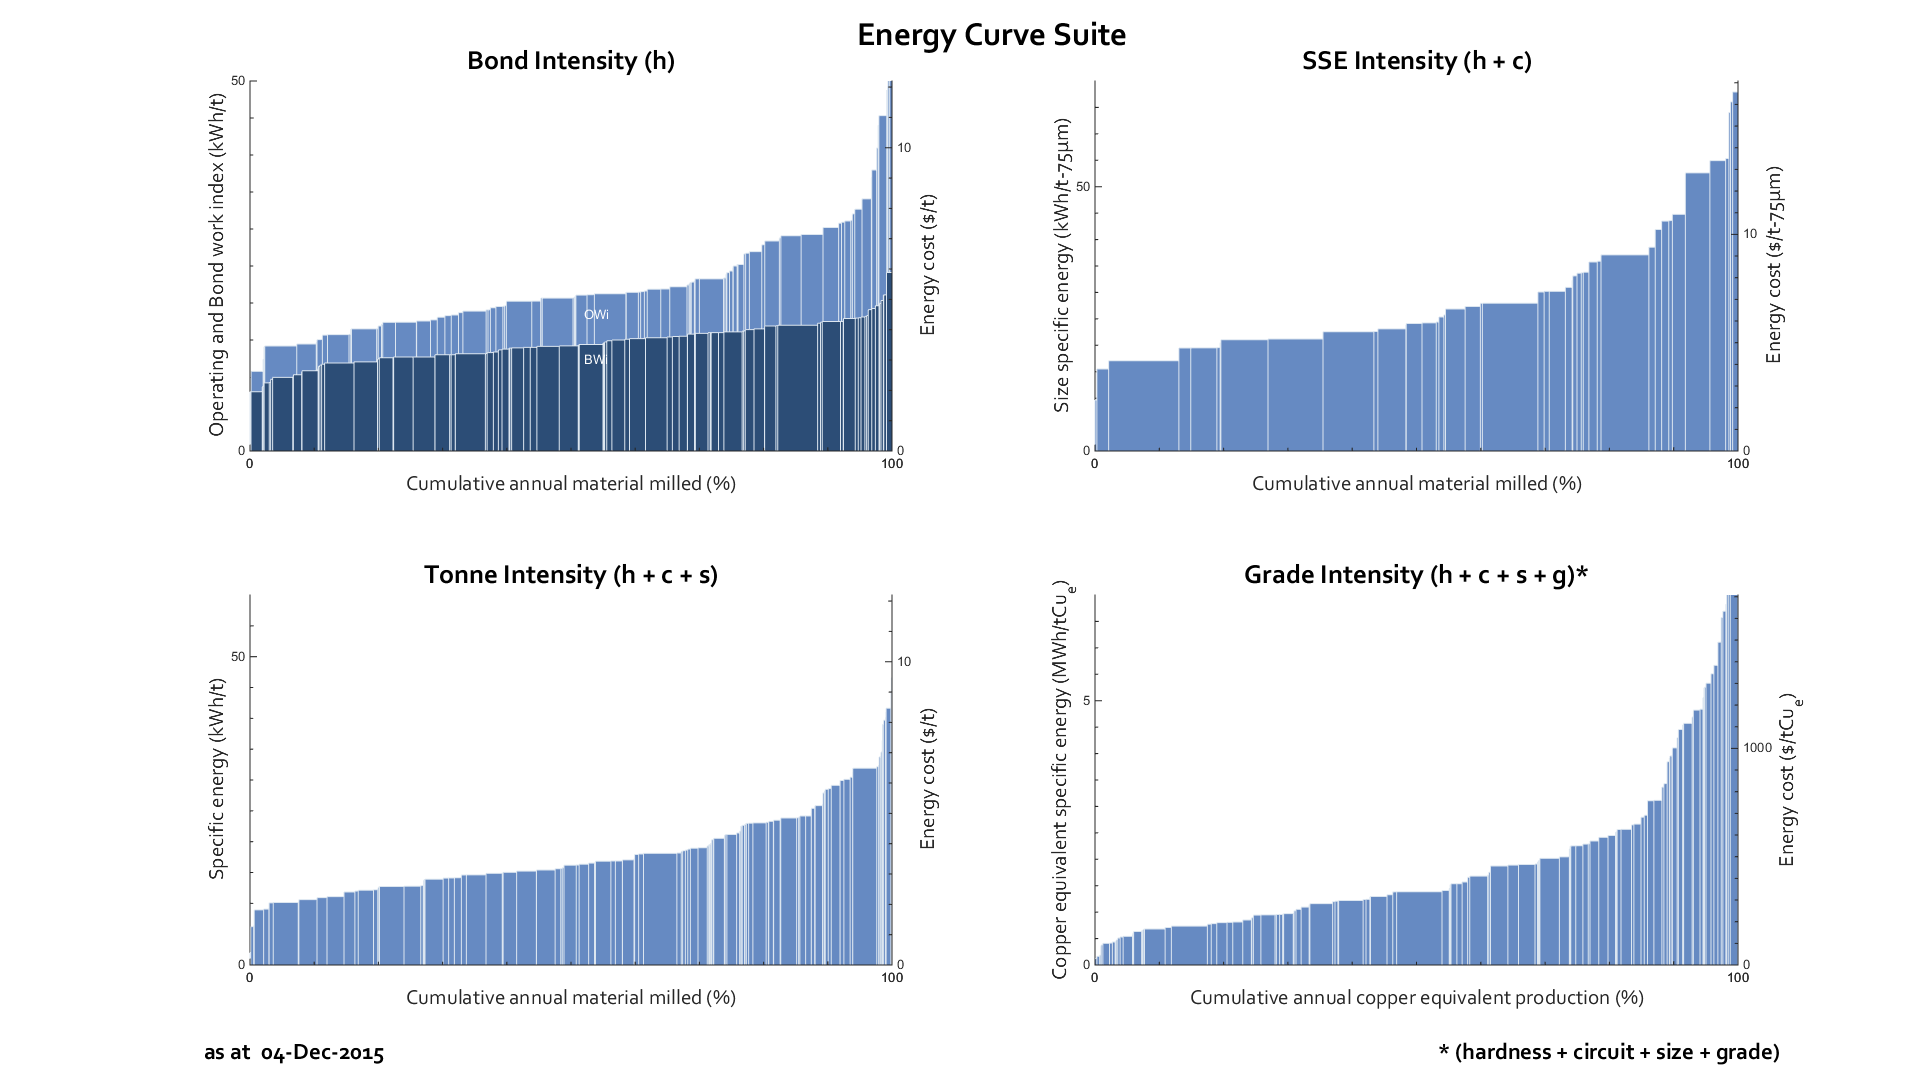
A suite of four energy curves have been configured to rank the relative energy intensity of a mine of interest with respect to the effect of ore hardness, circuit efficiency, grind size and feed grade. The first energy curve shows the impact of hardness as assessed using the Bond Work Index comparative methodology. Both the Bond Work Index (BWi) and the Operating Work Index (OWi) are presented as separate overlayed curves. The BWi is an industry standard laboratory measurement related to the specific energy requirement of a rock for a given P80 reduction. The OWi relates to how much energy is actually used on the plant to achieve the same P80 reduction. Presenting both these parameters together enables the mine to be benchmarked on both the laboratory competence measurement and the achieved energy consumption. Thus, if a mine was found to have an ore that is at the 70th percentile of BWi, but the 80% percentile of OWi (higher on the curve), this would indicate that this mine was underperforming in relation to the ore hardness.
The Size Specific Energy (SSE) intensity is a measure of how much energy is used in generating new sub 75 micron material. The SSE method has been used as an alternative to P80 reduction because it more accurately reflects that the majority of the energy is consumed in the generation of new surface area in the fines fraction (Ballantyne et al., 2015). The use of 75 µm is acknowledged to have no particular value in itself, for coarser of finer circuit products, another marker size would be equally appropriate. Both rock hardness (h) and circuit efficiency (c) contribute to determine the position of an operation on the SSE intensity curve. Thus, if an operation appears in the bottom third of the Bond intensity curve, but near the top of the SSE intensity curve, it would indicate that at least one area of the circuit is underperforming.
The data to derive the tonne intensity curve is the most readily obtained and is most easily understood by the non-technologist. The particle size of the circuit product (s) also affects the position of a mine on the tonne intensity curve. Therefore, the mineralogy of the ore contributes to the tonne intensity because it largely determines the required grind size. A fine-grained ore typically requires energy intensive fine grinding, pushing it up the tonne intensity curve.
The primary output of a mine is the production of metal which is captured by the grade intensity curve. The comminution energy required per unit of metal product is displayed in this curve. Poly-metallic ores are normalised by converting the respective metal values of other constituents to a copper-equivalent production. This is essentially the copper production that would be required to produce the same level of revenue as that from the other metals. The metal prices that were used in this analysis were obtained from annual reports in 2013 and represent the actual revenue realised by the mining companies.This curve displays both the metal prices used and the grade intensity curve coloured by commodity. This shows that using copper equivalent production is useful in comparing gold and copper mines (there is an equal distribution along the curve), but has the potential to under-estimate the contribution of comminution energy in other commodities (grouped at the bottom of the curve). The position of a mine on the grade intensity curve is largely determined by the metal grade of the mined material. Thus, a mine in the upper quartile of the grade intensity curve would likely benefit from investigating pre-concentration strategies such as grade engineering.